



UHC Statistics

Figures published by the National Health Security Office on who the Universal Coverage Scheme covers, what Thailand spends on health, how well households are protected from medical bills, and how satisfied beneficiaries and providers are.

Real-Time UHC Statistics

UC beneficiaries by entitlement group, February 2020 Donut chart. General public 45.5 percent, people aged over 60 19.2 percent, children under 12 18.4 percent, low-income people 12.5 percent, people with disabilities 3.1 percent, veterans 1.0 percent, monks and novices 0.3 percent. UC beneficiaries February 2020 Children under 12 18.4% Low-income people 12.5% People with disabilities 3.1% Monks and novices 0.3% People aged over 60 19.2% General public 45.5% Veterans 1.0%
UC beneficiaries by entitlement sub-group. Nearly half are covered as members of the general public, with people over 60 and children under 12 the next largest groups.
Source: NHSO real-time statistics, February 2020. Shares are read from the published chart, which does not print headcounts.

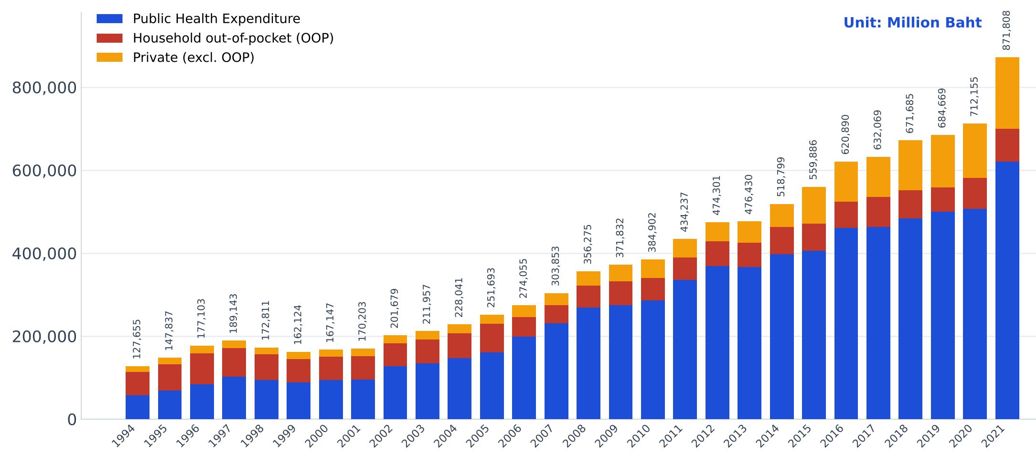
Total Health Expenditure

Source: National Health Account 2021.IHPP. MOPHI

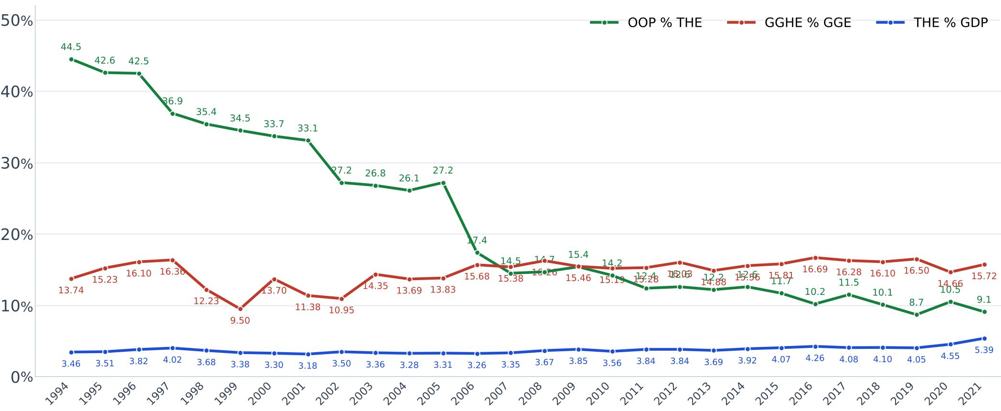
Health Financing

Indicatore: THE%GDP. GGHE%GGE. 0OP%THE. Source: National Health Account 2021 IHPP. MOPHI

Percentage of households with catastrophic health expenditure
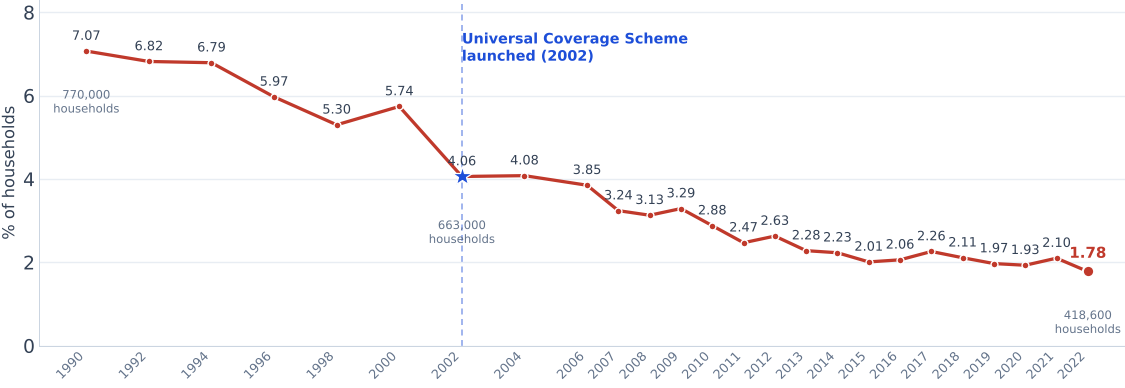
Source: Household Socio-Economic Survey, National Statistical Office 1990-2022; analysed by IHPP, MOPH. Catastrophic = out-of-pocket health spending over 10% of total household expenditure

Percentage of households with health impoverishment
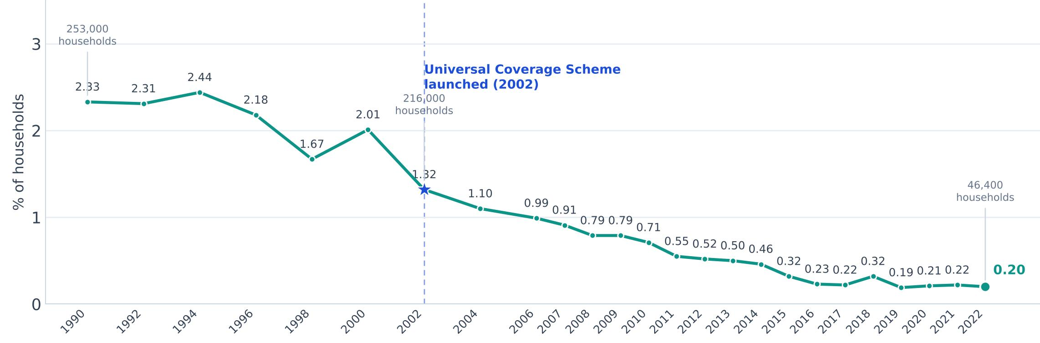
Source: Household Socio-Economic Survey, National Statistical Office 1990-2022; analysed by IHPP, MOPH. Impoverishment = household pushed below the poverty line by health payments.

Satisfaction of UCS members and providers
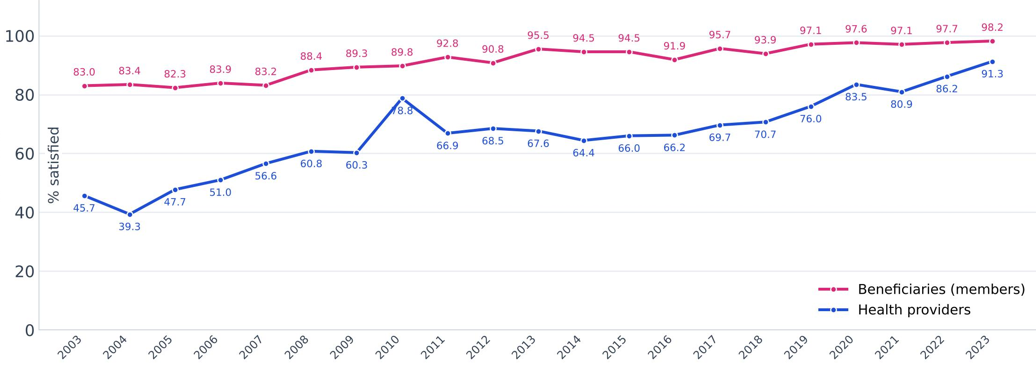
Sources: FY2003-2013 ANCHOR, Assumption University; FY2014 NIDA Poll; FY2015-2023 NHSO Satisfaction Survey. % scoring 7-10.